Few days ago MapLab made another article on Map Projections.
I really liked this quote”
Without John Snyder, LandSat would just make pretty pictures instead of beautiful maps. | NASA
Few days ago MapLab made another article on Map Projections.
I really liked this quote”
Without John Snyder, LandSat would just make pretty pictures instead of beautiful maps. | NASA
The positive impact that the Information Management System for Mine Action [IMSMA] has had in Humanitarian Mine Action [HMA] Programs around the world is undeniable. Kosovo, where IMSMA was deployed for first time, ended as one of the most successful HMA programs to date. A comprehensive understanding of the landmine problem is required to effectively manage an HMA program. Without the Information Management tools that IMSMA offers, this understanding would be very limited. Yet, it is arguable that IMSMA cannot be all things to all users, it does not contain all of the tools that an HMA program needs to make decisions about the most effective use of scarce funds and resources. There will always be a need for tools and methods that address specific problems and existing tools that have proven successful in other relief, development or governmental sectors should be at the top of the list for consideration.
The Problem
There is no “Super Tool” available, in the HMA community, which can efficiently perform all information capture, processing, reporting and management functions. IMSMA is not expected to, or able, to accomplish all possible information management tasks required or desired by HMA programs. Beyond IMSMA’s business process functionality, HMA planners must address strategic planning, operational planning, and cost estimation for projects, etc. The amount of information that is stored in IMSMA requires significant attention and resources to process and make it useful for planning and prioritizing of clearance activities. Mine Action managers need to be able to consider a wide range of factors to be able identify which HMA activities in which locations will have the greatest positive impact on communities and the economy. The impact of HMA on these communities must be measured not only in terms of the traditional mine action metrics like devices removed or destroyed and decreasing or elimination of future victim counts but must also be measured in terms of other national and local priorities. HMA planners and managers must be able to demonstrate how HMA activity contributes to positive outcomes in things like agriculture, economic development, infrastructure investment and stability to name a few.
National Mine Action Coordination Centers [MACC] often suffer from barriers between the Operations and Information Management Departments. The view that the Information Management Department should be a sub-set of the Operations Department illustrates a lack of understanding of information management processes, tools and the role they should play at all levels of HMA programs. There is a need for tools that not only facilitate intra-departmental information management work between HMA planning and operations but also facilitate this work on an intra-sectorial basis between HMA organizations and organizations engaged in other sector activity. Given this need, the author explored other tools that have proven their worth in governmental planning and/or socio-economic analysis fields, and that could be adopted to complement use of IMSMA in support of HMA policy and planning activities [see Figure 1].

Figure 1: SMCA within IMSMA Context
Furthermore, program and operations managers face the challenge of limited resources. To maximize the use of those resources, Information Management Departments must seek to identify and implement the tools, which will allow for a more well-informed decision-making processes concerning strategic and operational planning, prioritizing HMA activities and tasking of HMA assets. Effective information management is key to guiding the efforts of decision makers. The process of analysis for prioritizing clearance requires not only HMA data and knowledge but also input from the wider relief and development arena. We do not undertake HMA as a standalone activity, we do them in support of wider relief and development objectives. This decision-making activity, with access to a large number of diverse high quality data sets, makes a perfect case for the application of Decision Support Systems [DSS].
There are many tools that can serve the DSS role, however, few are able to do so effectively while incorporating spatial data. In addition, analyzing large amounts of data of varying types and importance requires a transparent process of collaborative decision making in order to ensure credibility and user “buy-in”.
The Challenge
Prioritizing HMA clearance is a complex task, in part because there are often numerous stakeholders associated with the process, each with his/her own view as to what constitute critical considerations. The operations department, communities, local and national economic considerations, victim assistance concerns, and many other interests all come into play, and often these groups do not view the problem from the same perspective or with the same value scale. Therefore, a method is required that can weigh and accommodate the requirements of these stakeholders. IMSMA is limited in doing this because the analysis tools that it contains are non-spatial and the score that is generated is per community [this score is calculated in LIS data] and not per hazard area.
There are also generic GIS tools like ArcGIS available. ArcGIS is a very flexible tool that allows for countless ways in which to conduct spatial analysis. Unfortunately, this flexibility comes with a cost. To effectively use ArcGIS as a DSS tool, users must have a high level of technical GIS skills, require a superior understanding of analytical modeling and must be able to create all or most of the steps in the analytical process from scratch.
Therefore, the challenge is:To complement HMA’s use of IMSMA for planning, prioritizing and executing clearance activities by incorporating as many relevant spatial data sets and stakeholder priorities as possible while keeping the process transparent
SMCA is a DSS tool, and as such does not make a decision on behalf of the user. Rather, it aids the user in making well-informed decisions. The problem being analyzed is structured in a way that allows addressing goals that are common to HMA programs. For example, the objective of “reducing the direct threat that Explosive Remnants of War [ERW] poses to a community” can be measured with any number of criteria. The user must have data for both the sub-objective and the criteria and a firm understanding of how the criteria and sub-objective are related.
For illustration purpose, we can take an example as follows [see Figure 2 & 3]. Let’s assume that we only have three criteria on “sub-objective 1”

Under this assumption, besides hazard data of course, we need to have data on community. To be more specific, we need:

Figure 3: Close-up of SMCA Tree
However, not all criteria within a sub-objective are equally important, and each are assigned a weight accordingly, for example by raking the above-mentioned criteria in order from highest to lowest importance. Say, distance from hazard is most important criterion, thus we list it on the top, and then the number of affected people, and at the bottom would be size of hazard. There are cases where one or more criteria may have equal importance, SMCA allows for this possibility as well. This method is called Ranking Order, and there are other methods such as Pair-Wise Comparison and Direct Input. The total weight of all criteria within the sub-objective must equal to the 100%.

The analysis and the outcomes from SMCA are heavily dependent upon spatial data, providing greater benefits than tabular data analysis alone.
![Hazard Area with four different scores [48, 44, 40 and 36]](https://sites.google.com/a/immap.org/asist/home/smce/smce-for-hma/Figure%205.png?attredirects=0)

This process provides additional feedback to the decision makers on the expectation and performance, and to foresee the potential problems so that they can
be addressed in shortest time possible.
Conclusion
IMSMA is a superior tool for HMA information management, and is nearly unique across the relief and development continuum. As such, it is a rare example of an entire sector adhering to the same basic set of information management business processes and structures. However as we stated earlier there are no super tools available that can be all things to all people. The HMA community will continue to need specialized DSS tools to facilitate the complex process of planning and prioritizing to make the best the use of the available human, technical and financial resources. The integration of SMCA into information management processes improves the utility of IMSMA and improves the quality of information available to decision makers, both internally and externally.
Comments welcome, of course.
For Map lovers, something totally worth reading again from MapLab at Wired. Follow the link and see how people obsess about map projections.
And the third posting at MapLab is a comparison between the Cahill’s Butterfly and the Dymaxion Projections. Very interesting article!
With all of it’s drawback, I find the Dymaxion more interesting!
Following up one the first article published by MapLab of Wired.
The second posting was, in case you missed it, back on November 7th 2013 and it’s about the Lambert Conformal Conic projection.
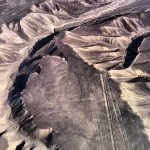
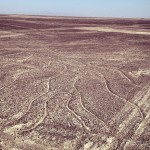


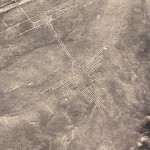

Peru’s Nazca Lines
To view more photos and videos of the Nazca Lines, visit the lineas de nazca and Lineas De Nazca location pages.
The Nazca Lines in the desert of southern Peru are a series of large designs etched into the arid ground. These designs, called geoglyphs by historians and archaeologists, depict animals, plants and geometric figures and are believed to have been a part of astronomical or religious rituals. Although the exact origins of the Nazca Lines are unknown, some scholars believe they were created by the Nazca culture between 400 and 650 AD. In 1994, they were designated as a UNESCO World Heritage Site.
The figures can be seen by plane, from atop the surrounding foothills, and through the photos and videos of Instagrammers fortunate enough to have made the trek.
The Wired Magazins’ new Blog “MapLab” is going to run a series of posting abut map projections. While some of us use GIS and other map making tools on a daily basis, probably we had to explain what map projections are and why do we have them, few times in our careers.
Now, MapLab is going to give, in layman’s language, some historical background, and the purposes of what for these projections were meant for, when they were first designed by their creators, and so forth.
The first one is about Mercator. I believe it’s a posting totally worth reading.
Link to the blog posting: http://bit.ly/12BWDnn
say you like Remote Sensing tasks, and you like Landsat data, and you like QGIS…then why not take a look at this page/tutorial. You won’t need $x000.00 of software, nor expensive data plus you don’t have to be an expert because the tutorial is very concise and esy to follow.
I wish I had this many years back when I was trying to do the same for a project.

The issue with the broken histogram creation tool in QGIS annoyed me far too long. Sometimes you just need a quick glance on the histogram of a raster just to make a decision on how to process it o…


You must be logged in to post a comment.